Oct. 21, 2016 (UPI) — Hillary Clinton holds a wide lead over Donald Trump in every minority group queried as part of the UPI/CVoter daily presidential tracking poll.
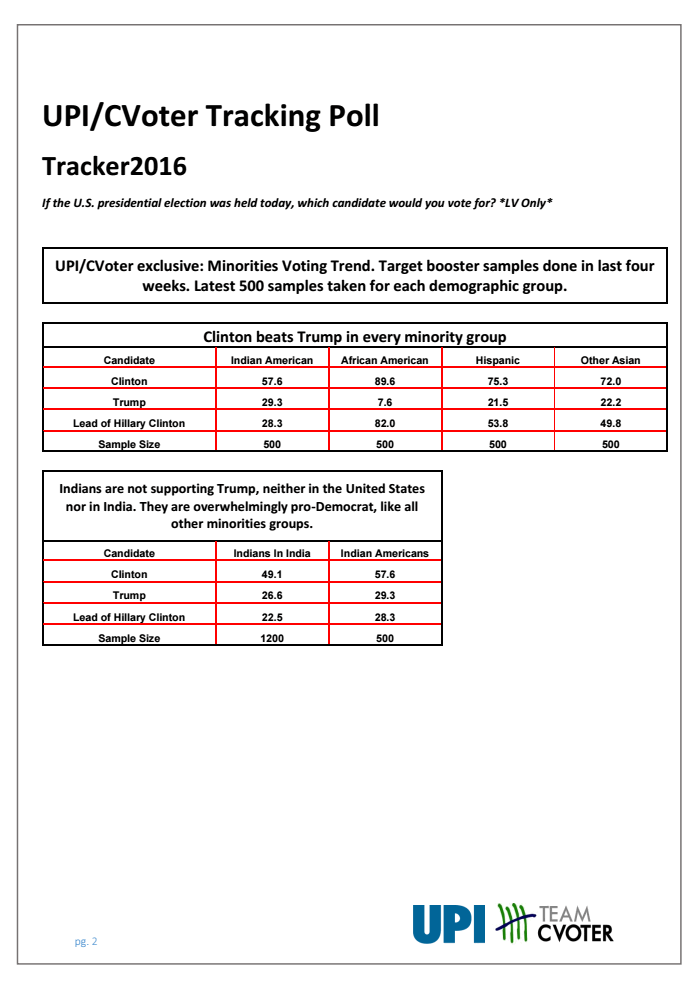
Examining a month’s worth of data among four minority groups — blacks, Hispanics, Asian Americans and Indian Americans — Clinton leads by an average of more than 2 to 1. Her largest lead is among African Americans, who favor her over Trump overwhelmingly, 89 percent to 7 percent. If that result holds on Election Day, it would mean Clinton earned a share of the black vote comparable to that of Barack Obama, the nation’s first black president.
The question for Clinton will be not what percentage of the black vote she earns — Democrats have routinely dominated that portion of the electorate — but how many votes she gets. Black voters turned out in record numbers in 2008 and 2012 to vote for Obama, but can that be replicated this year?
Clinton also holds a formidable lead among other minority groups.
Clinton’s second-largest lead is among Hispanics, who prefer her by a more than 3-to-1 margin, 75 percent to 21 percent. In that respect, Clinton is slightly out-performing Obama’s 2012 result. While the GOP’s 2012 nominee Mitt Romney angered many Hispanics by suggesting they should self-deport, Trump may see less support from the voting bloc after promising to deport all undocumented immigrants and build a wall on the Mexican border.
According to the UPI/CVoter poll, if the election were held today, Clinton would earn 4 percentage points more than Obama among Hispanics, while Trump would lag about 6 points behind Romney, who earned 27 percent of the Latino vote four years ago. That 10-point swing could provide Clinton a needed advantage in Hispanic-heavy swing states, particularly Florida and Nevada, where they make up a larger portion of the electorate than the national average.
Asian-American voters not from India, while a small percentage of the overall population, also lean toward Clinton by a wide margin — 70 percent to 22 percent. Asian Americans could prove a valuable subgroup of voters in two battleground states, however. In Virginia and Nevada, they make up a larger share of the population than in the nation as a whole.
Indian Americans are the most favorable minority group to Trump, but it’s still hardly a favor. They prefer Clinton by a 57 percent to 29 percent margin. The sentiment among Indian citizens versus Indian Americans is much the same. Indians living in India favor Clinton 49 percent to 26 percent.
The share of the U.S. electorate belonging to minorities is on the rise. More than 1 in 4 ballots were cast by a non-white voter in 2012, the highest rate on record. Whites made up 72 percent of the electorate in 2012. Combined, racial minorities were 28 percent.
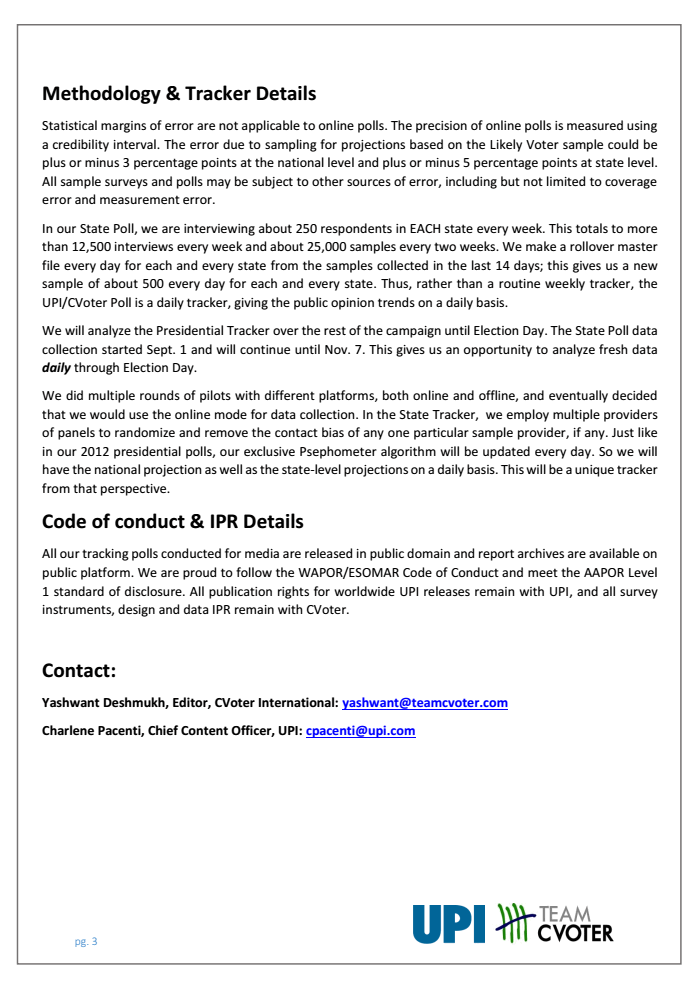
Data for the UPI/CVoter report on minorities in the 2016 election come from an analysis of minorities who have responded to the daily online tracking poll over the past four weeks. The most recent 500 respondents in each of the four categories were included in the percentages reported.
Because the poll is conducted online and individuals self-select to participate, no margin of error can be calculated. The poll has a credibility interval of 3 percentage points.


